
Environmental Stress Screening (ESS) is the process of exposing a newly manufactured product to environmental stresses in order to identify and eliminate latent defects introduced during the manufacturing process. It is part of the manufacturing process and is therefore performed on 100% of the items manufactured. After ESS, the remaining product population will have a higher reliability than a similar unscreened population due to the resultant elimination of infant mortality defects. The technique was first developed by the military to reduce the number of defects introduced during the manufacturing process of complex electronic assemblies. The screening process can range from providing a basic check of an electronic system prior to shipment (commonly called burn-in) to the application of much more severe environmental profiles, often involving many temperature and vibration cycles at extreme limits. The benefits of screening depend on the maturity of the manufacturing process, with more mature processes expected to introduce fewer defects. One estimate of the potential benefit is provided by the Telcordia reliability prediction standard (SR-332, Issue 1), which estimates that the failure rate of a system population is four times higher at initial deployment than it will eventually be after one year, as shown in Figure 1, the bathtub curve. This means that if no ESS is performed, it will take up to one year for the population to naturally reach the expected steady state failure rate observed during the useful life period.
Figure 1 – Bathtub Curve
Typical Stress Levels
There are a number of different methods to determine the ESS profiles. Traditionally, these profiles have been determined by guidelines published in military documents such as DOD-HDBK-344, “Environmental Stress Screening of Electronic Equipment” and/or guidelines published by the Institute of Environmental Sciences and Technology. Table 1 summarizes typical ESS guidance from the USAF Rome Laboratory Reliability Engineer’s Toolkit.
|
Screen Type, Parameter |
Printed |
Equipment Level |
| Thermal Cycling Screen | ||
| Temperature Range (Minimum) |
From -50°C to +75°C | From -40°C to +71°C |
| Temperature Rate of Change (Minimum) | 20°C/Minute | 15°C/Minute |
| Temperature Dwell Duration | Until Stabilization | Until Stabilization |
| Temperature Cycles | 20 to 40 | 12 to 20 |
| Power On/Equipment Operating | No | On during heating, Off during cooling |
| Equipment Monitoring | No | Go/no-go performance monitoring |
| Electrical Testing After Screen | Yes (At Ambient Temperature) | Yes (At Ambient Temperature) |
| Random Vibration | ||
| Acceleration Level | 6 Grms | 6 Grms |
| Frequency Limits | 20 – 2000 Hz | 20 – 2000 Hz |
| Axes Stimulated Serially or Concurrently | 3 | 3 |
| Duration of Vibration (Minimum) o Axes stimulated serially o Axes stimulated concurrently |
10 Minutes/Axis 10 Minutes |
10 Minutes/Axis 10 Minutes |
| Power On/Off | Off | On during heating, Off during cooling |
| Equipment Monitoring | No | Go/no-go performance monitoring |
Screening Strength
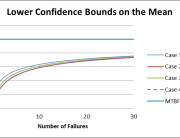
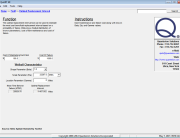
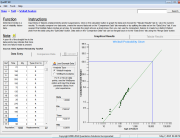
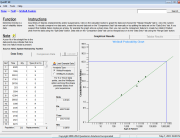
To quantify and refine the above starting point guidance, “screening strength” models have been developed to assess the impact of varying stress levels, screening durations and defect detection approaches. These models were developed by the Air Force (RADC-TR-86-149, Environmental Stress Screening) and are implemented in the Quanterion Automated Reliability Toolkit (QuART), as shown in Figure 2. This tool allows the calculation of relative screening “strengths” at various assembly levels (the system level is highlighted in Figure 2). It can be used to assess and quantify the relative differences between fixed frequency and random vibration screens, different temperature extremes and different fault detection approaches. For example, changing from a simple temperature soak at 75C for 8 hours, as shown in Figure 3, to screening for 20 cycles between -50C and 75C, as shown in Figure 4, increases the strength of the screen from magnitude 1.59 to 9.01 resulting in a 5.67 times increase in screening strength (9.01/1.59 = 5.67).
Figure 2 – QuART Test Strength Calculator
Figure 3 – Temperature Soak Calculator
Figure 4 – Temperature Cycling Calculator
HALT / HASS
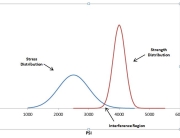
Another approach to determine screening levels is to conduct a Highly Accelerated Life Test (HALT) to determine operating and destruct margins, as shown in Figure 5. HALT is a process to evaluate a design to identify weaknesses as well as to determine effective stress limits for Highly Accelerated Stress Screening (HASS). HALT evaluates equipment in terms of operating and destruct margins through applying stresses. It is usually performed on a few early units to determine appropriate limits for follow-on HASS, which is performed on 100% of manufactured product. HALT/HASS can be performed at various assembly levels, from circuit board to system.
Figure 5 – HALT Stress Thresholds
Component Level Screening
If screening is performed at the component level, knowledge of specific failure modes and accelerating stresses that precipitate these modes can provide valuable insight into the selection of appropriate screens. The QuART software also provides this type of guidance for electronic component failure modes. For example, voltage and temperature are accelerating factors for ceramic capacitor dielectric breakdown, as shown in Figure 6. This failure mode data, developed by US Air Force studies, provides insight into the most appropriate types of stresses for a wide range of electronic components.
Figure 6 – Ceramic Capacitor Failure Accelerating Factors