This Reliability Que will discuss how Weibull analysis qualitative results showing a wearout failure mode can be utilized to quantitatively drive the decision making process in Reliability Centered Maintenance (RCM) programs.
RCM Basics
As defined in NAVAIR 00-25-403, “Guidelines for the Naval Aviation Reliability-Centered Maintenance Process”, RCM is “an analytical process to determine appropriate failure management strategies, including Preventive Maintenance and other actions that are warranted to ensure safe operation and cost-wise readiness”. Similarly, NASA defines the purpose of RCM as “a process that is used to determine the most effective approach to maintenance. It involves identifying actions that, when taken, will reduce the probability of failure and which are the most cost-effective.” A formal RCM process identifies the following seven steps, in sequence:
- Define System Functions – the desired capability of the system, how well it is to perform, and under what circumstances
- Analyze the Potential Functional Failures – the failed state of the system (when the system falls outside the desired performance parameters)
- Determine Failure Modes – the specific condition causing a functional failure
- Describe Failure Effects – the description of what happens when each failure mode occurs
- Determine Failure Consequences – the description of why the loss of function matters
- Develop Maintenance Tasks and Intervals – the description of the applicable and effective tasks, if any, performed to predict, prevent, or find failures
- Consider Other Logical Actions – including, but not limited to, run-to-failure, engineering redesigns, and changes/additions to operating procedures or technical manuals
Why RCM?
Over the years, RCM has been used to achieve significant cost savings in a variety of industries, as well as U.S. Department of Defense programs. For example, RCM performed on the F-15 Environmental Control, Fuel, Landing Gear, Flight Control, and Oxygen and Canopy systems resulted in 538 recommended changes to maintenance procedures, with an expected savings of $21M/year (~450K manhours).
The objective of an effective RCM program is not to eliminate failures (that’s the job of Design for Reliability (DFR) and Design for Maintainability (DFM) processes), but to reduce or mitigate the consequences of a failure when one occurs. The consequences of failure are usually assessed by their impact in the following areas (and are considered critical elements in a comprehensive Asset Management strategy):
- Personnel and Equipment Safety
- Environmental Health/Compliance
- Operations (Availability)
- Economics
The following is an example of a Weibull analyses that was performed on a system as part of an RCM process and how the results led to data based decisions. By utilizing a Weibull distribution, an analyst can determine the reliability of a system for a given period of time and also have insight into additional failure characteristics (e.g. early failures, constant failure rate, wearout condition).
Cost Optimized Preventive Maintenance
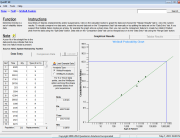
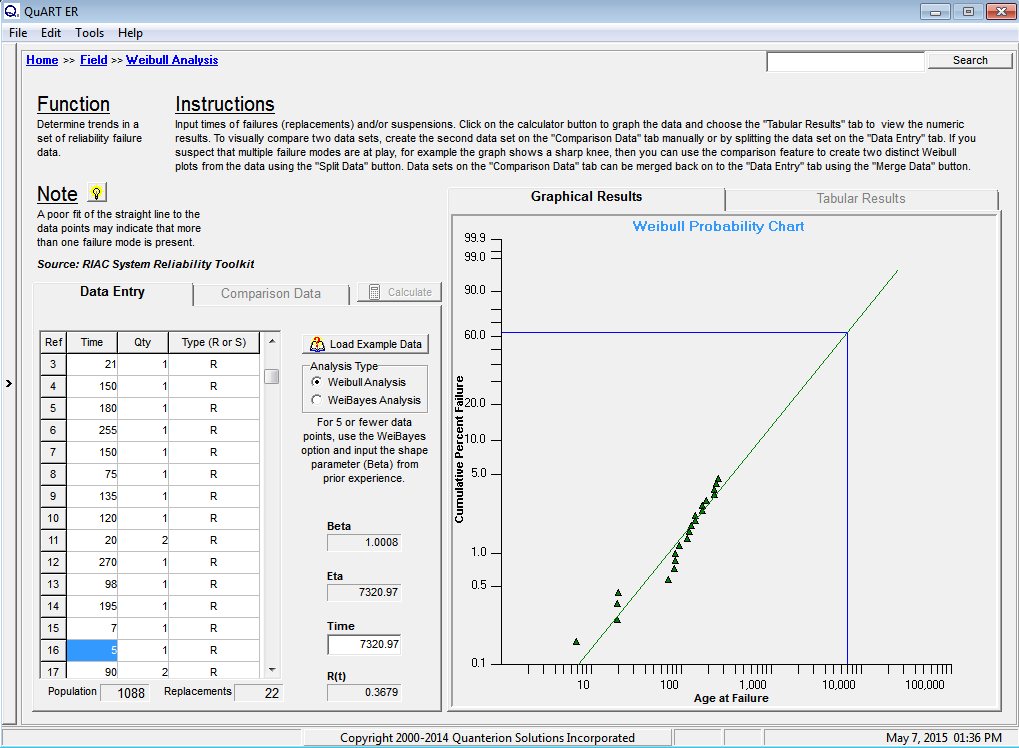
The example comes from an RCM analysis performed on a fleet of 34 trucks, of which 7 had experienced a failure while in transit. The failure was attributable to a key component in the fuel system that caused the engine to stall without warning and prevented the engine from restarting. This failure not only created a safety concern, it also had a large economic impact, as the trucks were expensive to repair on the road. The Quanterion Automated Reliability Toolkit – Enhanced Reliability (QuART-ER) tool was used to perform the Weibull analysis for this component failure and is shown in Figure 1.
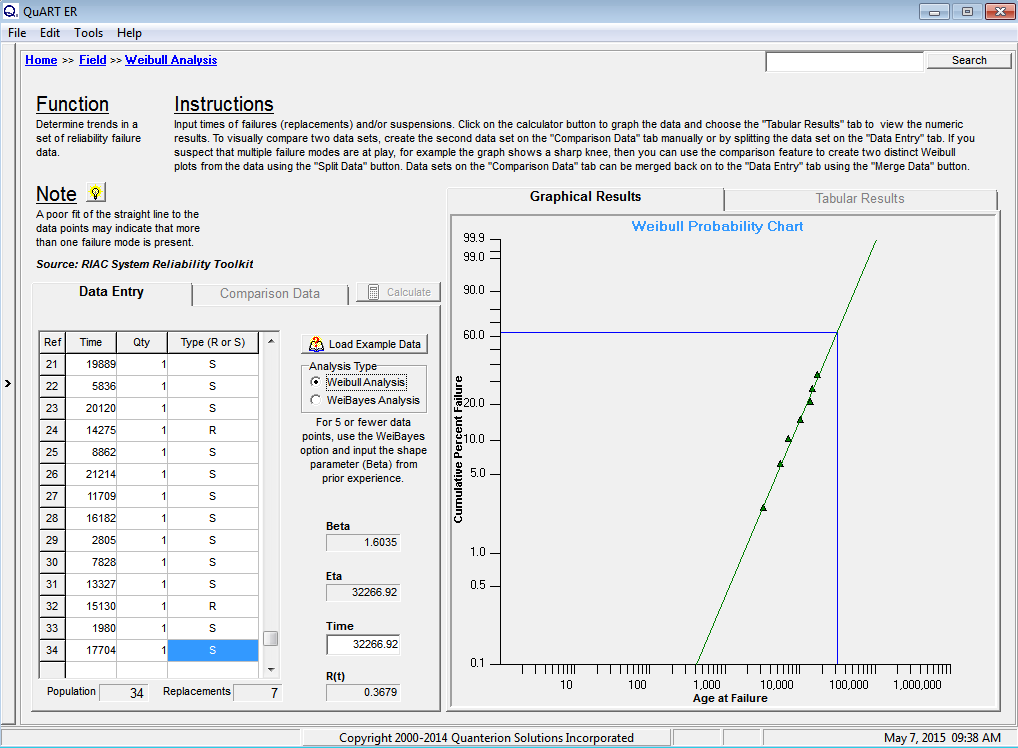 Figure 1: Fuel System Failure
A closer inspection of the results in Figure 1 indicates that the dataset can be well represented by a 2-parameter Weibull distribution. The failure data points are well in line with the predicted result. Note that only failure data is plotted when using the Weibull analysis Rank Regression technique. This is not to say that suspension data is not important to the analysis, as it is a critical component to the reliability prediction result. Although not plotted, the suspension data does influence the appropriate plot positions of the failure data. For more information on the Weibull Analysis process click here.
The two parameters of interest in the analysis are the characteristic life (Eta = 32,267 miles) and the slope of the Weibull line (Beta = 1.6). Eta is utilized to calculate the Mean Time To Failure (MTTF) for the system while Beta describes the failure characteristics (e.g. Beta < 1 = early failures, Beta = 1 = constant failure rate, Beta > 1 = wearout condition).Of particular importance in the RCM decision-making process is the value of Beta. In the current analysis, the fuel system component was showing a slight wearout condition, as the value of Beta was greater than 1.0. With this being the case, an “optimal time of replacement” analysis was performed based on the total cost of maintenance.
Although maintenance costs for component replacement in the shop were well known, the maintenance cost for repair on the road needed to be calculated. These included travel costs for the maintenance mechanic, maintenance vehicle usage costs, disabled truck downtime costs (including “idle driver” costs) and an estimated opportunity cost for lost reputation due to late deliveries. The end result of the analysis showed that a failure in the field was up to 10 times the cost of a scheduled replacement. Using this 10:1 ratio and the Optimal Replacement Interval tool in QuART-ER, an analysis was performed, with the results shown in Figure 2.
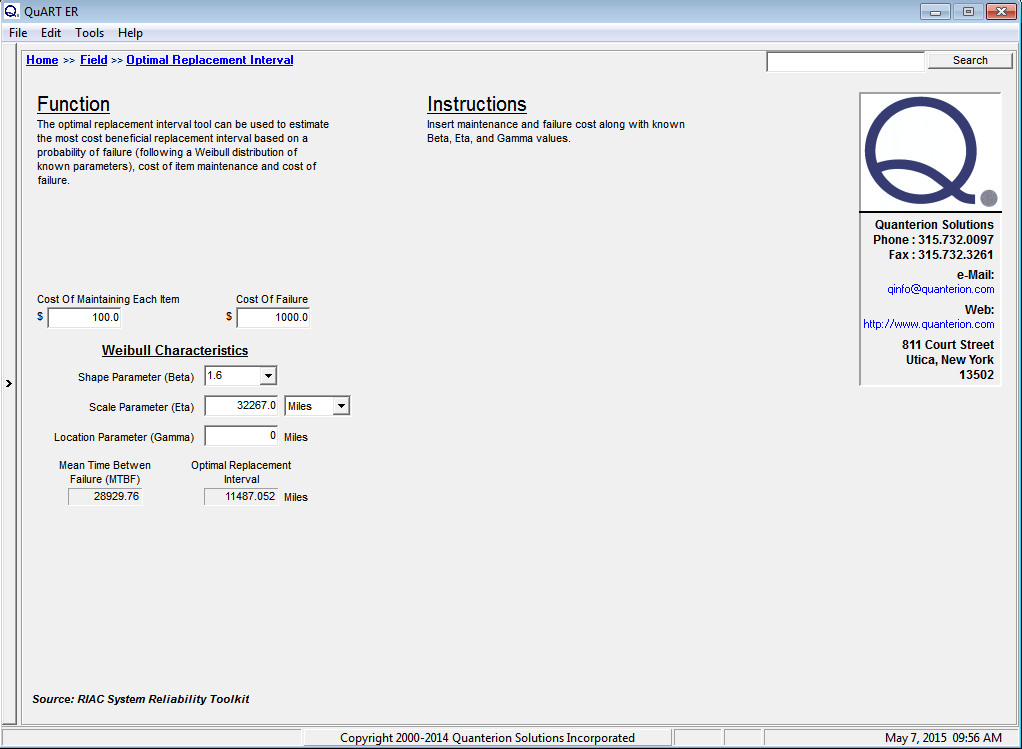 Figure 2: Optimal Time of Replacement Analysis
As can be seen from the figure, the optimal time for replacement to minimize costs is 11,500 miles. Note that if fleet reliability were deemed to be more critical than cost, the same 2-parameter Weibull analysis result could have been utilized to determine an optimal time for replacement based on availability requirements.
Conclusion
This discussion was meant to illustrate how Weibull analysis can be used to guide a RCM strategy. Understanding the underlying failure distribution of an item is critical in order to determine whether or not preventive maintenance is appropriate and cost-effective and, if so, at what interval. Equally important is the understanding of preventive and corrective maintenance times, preventive and corrective replacement costs and equipment design life. Finally, a clear understanding of safety and mission reliability requirements is critical for optimizing an RCM-based preventive maintenance program.