
There are those who would argue that the costs of reliability activities associated with developing new products have little payoff. Whether we’re talking about commercial products or military systems, we don’t agree. Concepts like Life Cycle Costs, Total Ownership Costs, Reliability-based Maintenance, Performance-Based Logistics, and others clearly recognize the contribution of reliability activities in reducing costs.
In this article we’ll examine three different cost-related aspects of reliability:
- How much do typical reliability activities cost during product development?
- What’s the payback period for an investment in improving a product’s reliability?
- What’s the impact of reliability on warranty costs?
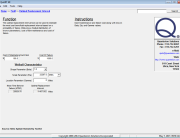
Cost of Reliability Activities: Many studies have attempted to develop models for the cost of performing reliability-oriented tasks. Probably the most recent is published in the Navy guidebook “Best Bang for the Buck: the Cost of Technical Processes” (NAVSO P–3691). This document provides models relating the cost of various activities to the number of parts and number of LRUs that make up a design. For example, Figure 1 shows Quanterion’s QuART PRO software module estimating the cost at $26,775 for a parts count reliability prediction and a part-level failure mode and effects analysis for a design including 500 electronic parts. Similarly, the cost of other reliability tasks can be estimated using the Navy models.
Figure 1 – QuART PRO Estimation of Reliability Activity Cost
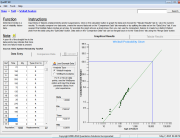
Reliability Investment Payback Period: Many management decisions consider the “pay-back period” as a criterion in the decision process. For example, what’s the payback period and the “return on investment” (ROI, reciprocal of payback period) for an investment of $50,000 to eliminate 230 failures per year, each with an average repair cost of $100? Assuming an overhead rate of 30% and a profit of 10%, the payback period is 3.11 years and the ROI is 0.32. The example is shown in Figure 2, again using QuART PRO. If the reliability improvement reduced the number of failures only by 130, the payback period would be much longer (5.50 years) as should be expected.
Figure 2 – QuART PRO Example of Payback Period for Reliability Improvement
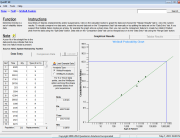
Warranty Costs: The level of reliability for a product is critical to warranty cost objectives. So, what is the level of reliability needed to achieve a warranty cost to sales revenue ratio of 3% for a product that sells for $1000. The expected sales are 2000 units, the warranty duration is one year, the average repair cost $100, and the repair cost to total warranty cost ratio is 80%. Again exercising a QuART PRO calculator as shown in Figure 3, the required mean-time-between failures (MTBF) is 36,500 Calendar Hours. If the duty cycle is 100%, then calendar hours are the same as operating hours. The expected total warranty costs are $60,000. If the cost per repair went up to $200 per repair, the required MTBF would have to be increased to 73,000 hours to maintain the same warranty cost goal.
Figure 3 – QuART PRO Example of Reliability Level Necessary to Meet Warranty Cost Goals
While the above examples are hypothetical, and the inputs chosen may not be realistic for your type of applications, they do demonstrate the relationship between reliability and costs from several different perspectives.