Manufacturers are often faced with questions such as:
- How often will my system fail?
- How many spare parts should I stock?
- How confident am I that I will have enough spare parts?
We recently had a customer that had to answer these and other questions pertaining to warranty and system support issues. They were delivering a new system and had to provide on-site support for the next three years. They had performed a detailed reliability analysis of the system and had collected preliminary test data during initial operational testing. Based on this information they had good insight into the mean time between failure (MTBF) of various system items.
Initially, the customer was going to estimate the number of spares by simply dividing the mean time between failure (MTBF) for a particular line replaceable unit (LRU) by the time period they had to provide support. For example, the system transmitter had an MTBF of 8760 hours (i.e., one year operating continuously) and support had to be provided for 26,280 hours (three years); therefore, they were going to purchase three spares. The support contract also dictated that the system be repaired within 24 hours; therefore, sufficient transmitters had to be “on hand.” Because of potential part obsolescence issues, all spare transmitters had to be built within the first year of system deployment. This raised the question: how confident are we that three spares will be sufficient?
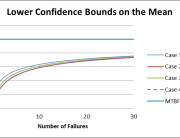
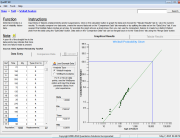
To answer this question, the sparing analysis tool included in the Quanterion Automated Reliability Toolkit (QuART) was used. This tool implements the Poisson distribution to calculate the likelihood (probability) that a certain number of failures will occur over a given period of time. It takes as input, the number of units in service, the unit MTBF, and the time period being considered. Figure 1 shows the graphical output from QuART addressing the transmitter sparing issue. With the customer’s original plan, there was only 42% confidence that three spares would be sufficient (red line) over a three year time period. In order to be more certain, say 90% confident, six spares (rounded up) would have to be procured (yellow line). Six spares will actually provide a confidence level slightly better than 90%.

Figure 1: QuART Sparing Calculation: Spares Needed for a Three Year Period
The above approach can be a bit simplistic and may overlook important issues such as:
- MTBF Input Values in Error. What if the MTBF values used as input (predicted, test values or other data) are significantly in error? The “Poisson calculation takes as input “true” MTBF (i.e., that MTBF that would be exhibited if infinite units were tested for an infinite time period).
- Repair of Replaced Units. What if some of the failed units can be repaired and reentered into the spares inventory?
- Field Replacement of Good Units. What if customers and/or maintenance technicians incorrectly troubleshoot and replace good items?
MTBF Input Values In Error
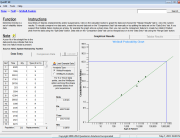
To address the first concern, we reduced the risk of immediately procuring too many spares by considering procurement lead-time. For example, if an item could be replenished into the spares inventory in three months, enough spares were initially procured to be highly confident of having enough for the first three-month window. To make this calculation we adjusted the period of interest from 26,280 hours to 2,190 hours as shown in Figure 2. Thus, the number of spares that need to be procured for a three month window is only two (to provide ~98% confidence of having enough spares) compared to six spares (to provide ~92% confidence of having enough spares) calculated for a three year window. Using a three-month window, available spares inventory levels were then carefully monitored and projections of future needs made.
Figure 1: QuART Sparing Calculation: Spares Needed for a Three Month Period
Repair of Replaced Units
What if some percentage of field replaceable units can be repaired and reentered into inventory? The initial Poisson calculations assume that failed items are disposable items. If the item under consideration is repairable, the Poisson sparing calculation can be used to make initial near-term estimates based on the specific maintenance scenario (e.g., turn around time requirements, logistics delay time, etc.) with follow-on “real time” monitoring of ongoing spares inventory levels.
Field Replacement of Good Units
What if the lack of on-site troubleshooting capability results in the field replacement of good units? This concern cannot easily be addressed in the initial spares calculation process. It requires experience data. However, like the second concern above, this can be overcome by close ongoing monitoring of inventory levels along with a comprehensive failure reporting and corrective action system. Comprehensive system modeling and simulation tools exist that can be used to model a wide range of scenarios and policies. For example, see http://www.hps-inc.com/MoreAboutSytemsThinking.htm.
In summary, the “right” answer on sparing decisions requires consideration of many factors. QuART, which can be purchased or downloaded for free, provides an easy method to make quick initial estimates. Other tools and models are available to address a wider array of input variables.
For questions or comments on this article or other reliability issues, e-mail us at qinfo@quanterion.com.
For more Information:
- Prioritizing the Purchase of Spare Parts Using an Approximate Reasoning Model; Eisenhawer, S.W.; Bott, T.F.; Jackson, J.W.; 2002 Reliability and Maintainability Symposium Proceedings, Page(s): 20-25
- Spares-Inventory Sizing for End-to-End Service Availability; Chan, C.K.; Tortorella, M.; 2001 Reliability and Maintainability Symposium Proceedings, Page(s): 98-102
- An Optimal Sparing Model for the Operational Availability to Approach the Inherent Availability; Oliveto, F.E.; 2001 Reliability and Maintainability Symposium Proceedings, Page(s): 252-257
- Predicting Operational Availability for Systems With Redundant, Repairable Components and Multiple Sparing Levels; Mitchell, B.F.; Murry, R.J.; 996 Reliability and Maintainability Symposium, Proceeding, Page(s): 301-305
- Innovations in Military Spares Analysis; Dreyer, S.L.; Smith, G., II; 1995 Reliability and Maintainability Symposium Proceedings, Page(s): 397-401
- The Spares Calculator: A Visual Aid to Provisioning; Mickel, L.S.; Heim, R.L.; 1990 Reliability and Maintainability Symposium Proceedings, Page(s): 410-414
- Sparing Analysis-A Multi-Use Planning Tool; Myrick, A.; 1989 Reliability and Maintainability Symposium Proceedings, Page(s): 296-300
- SPAREL: A Model for Reliability and Sparing in the World of Redundancies; Nordin, A.; Maier, F.F.; 1989 Reliability and Maintainability Symposium Proceedings, Page(s): 313-320
- Sparing Criteria. Clear Management Approach; Bluvband, Z.; Shahaf, S.; 1984 Reliability and Maintainability Symposium Proceedings, Page(s): 446-451
- Optimization of Spares in a Maintenance Scenario; Coughlin, R.J.; 1984 Reliability and Maintainability Symposium Proceedings, Page(s): 371-376