
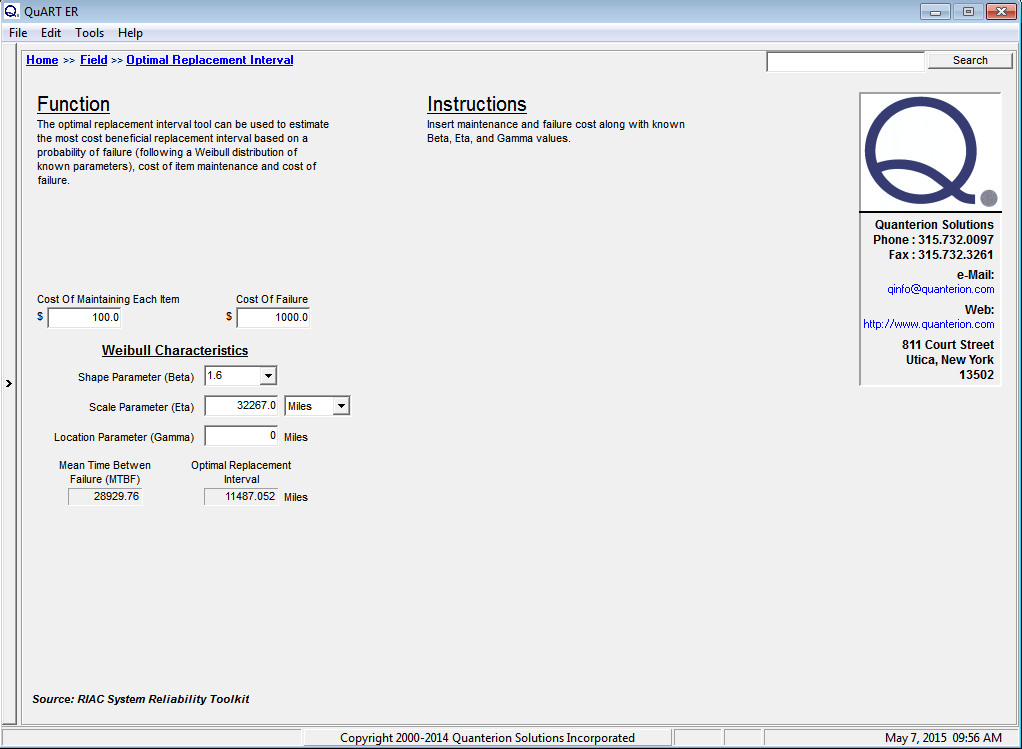
For demonstrating product reliability the question of how many test samples are needed to be “X” percent confident of having met a reliability objective often comes up. Let’s say that manufacturer is going to produce 5,000 rooftop car carriers and is willing to tolerate roughly 100 returns over the next five years. How can this be verified?
The first step is to figure out how to simulate five years of life. This might be accomplished with accelerated mechanical cycling, thermal cycling, some combination of environmental inputs or some static load test such that if a design sample survives the test it will be guaranteed to survive five years with “100% confidence.”
Sample Size
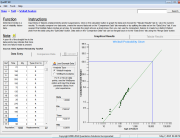
One way to look at the sample size question is from a pass/fail criteria at the five year point. This allows the Binomial distribution to be used for calculating the reliability of the total population for five years based on a test of samples. But, how many samples? The QuART PRO Binomial Confidence Calculator provides a method for performing this calculation. First, let’s say that a manufacturer wants to be 90% confident that 100, or fewer returns will be experienced. Entering a 10% lower tail probability (100% minus the desired 90% confidence level), 0% upper tail probability and a proportion of Successes to Total Trials of 4900/5000 into the QuART PRO Binomial Confidence calculation tool shown in Figure 1 provides the following results.
For the inputs shown in Figure 1, the manufacturer can be 0.98 confident that the true reliability of is 0.977, or better. This is shown in the results area of Figure 1 and means that the manufacturer can:
- Expect (0.98)(5000) = 4,900 Successes
- Expect (1-0.98)(5000) = 100 Failures
- Be 90% confident that no more than (1-0.977)(5,000) = 115 failures will occur
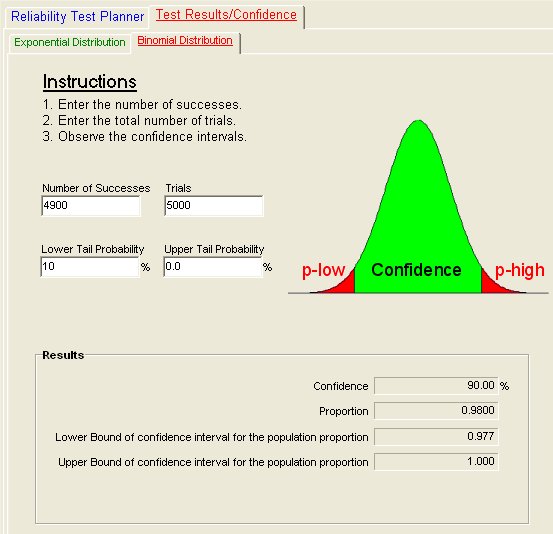
Figure 1: Complete Population Testing
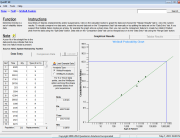
- Expect (0.98)(5000) = 4,900 Successes
- Expect (1-0.98)(5000) = 100 Failures
- Be 90% confident that no more than (1-0.977)(5,000) = 115 failures will occur
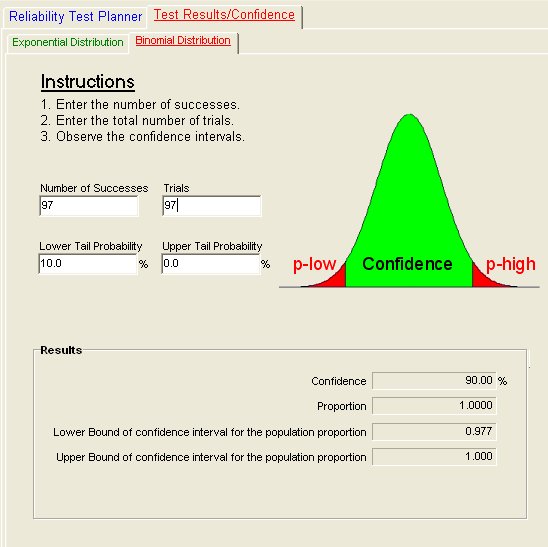
Figure 2: Sample Population Testing
- Test samples are representative of the population as a whole.
- If an accelerated test is used, a correlation between the test regime and the reliability objective in actual operation can be established.